Retrieve Data
def _get_cloud_asset_data(device, time_from, time_to, asset_name, pagenmb):

    """
    Retrieves paged collection of historical asset states within provided time range.
    https://api.allthingstalk.io/swagger/ui/index#operation/AssetStates_GetAssetHistoricalStates

    Parameters
    ----------
    device: type dict
        device description (defined in a json file)
    time_from: str
        start time, ex. 2020-09-08T00:00:00 (iso8601 format)
    time_to: str
        end time, ex. 2020-09-08T23:59:59 (iso8601 format)
    pagenmb: int
        Page in the result set

    Returns
    -------
    response.json()['data']:

    """

    url = "https://"+device["device"]["authentication"]["api"]+\
    "/device/"+device["device"]["authentication"]["Device_ID"]+\
    "/asset/"+asset_name+"/states?from="+time_from+"&to="+time_to+"&page"+str(pagenmb)

    payload = {}

    headers = {
        'Authorization': device["device"]["authentication"]["Ground_Token"],
        'Content-Type': 'application/json'
    }

    response = requests.request("GET", url, headers=headers, data = payload)

    return response.json()['data']


def _fill_missing_data(timestamp, data):
    k = 0
    new_data = []

    for i in range(len(timestamp)):
        if timestamp[i] == data[k]['at']:
            new_data.append(data[k])
            k = k + 1
        else:
            new_data.append({'at': timestamp[i], 'data': -666})

    return new_data


def _get_timestamps(cloud_data):
    length = []
    for i in range(len(cloud_data)):
        length.append(len(cloud_data[i]))
    pos_max_value = length.index(max(length))

    timestamp = []
    for i in range(max(length)):
        timestamp.append(cloud_data[pos_max_value][i]['at'])
    return timestamp


def cloud_data_to_df(device, time_from, time_to):
    """
    Retrieve Cloud data and translate it to a pandas dataframe
    Raw data from the assets: Counter, Temperature_degC, Humidity_perc, CO2_ppm

    Important:
    ----------
    - take max. 24h or 1 day
    - time in UTC - ISO 8601 Format

    Parameters
    ----------
    device: type dict
        device description (defined in a json file)
    time_from: str
        start time, ex. 2020-09-08T00:00:00 (iso8601 format)
    time_to: str
        end time, ex. 2020-09-08T23:59:59 (iso8601 format)

    Returns
    -------
    cloud_data_df: df
        a pandas dataframe is returned

    Example
    -------
    >>> import json
    >>> import pandas as pd

    """

    columns = ['time']
    for asset_nmb in range(len(device["device"]["assets"])):
        asset = 'asset#' + str(asset_nmb)
        columns.append(device["device"]["assets"][asset]["name"])

    cloud_data_df = pd.DataFrame(index=range(0), columns=columns)

    asset_name = []
    asset_unit = []

    for asset_nmb in range(len(device["device"]["assets"])):
        asset = 'asset#' + str(asset_nmb)
        asset_name.append(device["device"]["assets"][asset]["name"])
        asset_unit.append(device["device"]["assets"][asset]["profile"]["unit"])

    cloud_data = []
    for name in asset_name:
        cloud_data.append(_get_cloud_asset_data(device, time_from, time_to, name, 0))

    # ------------------------------------------------------------------------------------------------------------------
    new_cloud_data = []
    for i in range(len(cloud_data)):
        new_cloud_data.append(_fill_missing_data(_get_timestamps(cloud_data), cloud_data[i]))
    cloud_data = new_cloud_data
    # ------------------------------------------------------------------------------------------------------------------

    for k in range(len(cloud_data[0])):
        date_time_str = cloud_data[0][k]['at'][0:10] + ' ' + cloud_data[0][k]['at'][11:19]
        sample = {'time': datetime.datetime.strptime(date_time_str, '%Y-%m-%d %H:%M:%S'),
                  asset_name[0]: int(cloud_data[0][k]['data']),
                  asset_name[1]: float(cloud_data[1][k]['data']),
                  asset_name[2]: float(cloud_data[2][k]['data']),
                  asset_name[3]: int(cloud_data[3][k]['data']),
                  }
        cloud_data_df = cloud_data_df.append(sample, ignore_index=True)

    return cloud_data_df
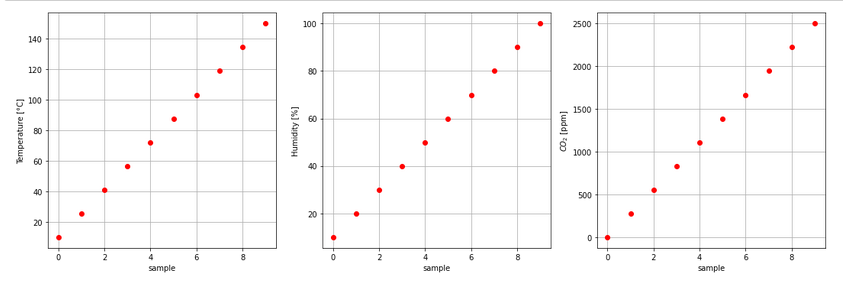
Below an Python example script where we send 10 samples (temperature, humidity and CO2) to the Cloud.
# data samples
import numpy as np
import matplotlib.pyplot as plt

# 10 samples
nmb_samples = 10
Temp_degC = np.linspace(10, 150, num=nmb_samples)
Hum_perc = np.linspace(10, 100, num=nmb_samples)
CO2_ppm = np.linspace(0, 2500, num=nmb_samples)


fig, (ax1, ax2, ax3) = plt.subplots(1, 3, figsize=(15,5))
ax1.set(xlabel='sample', ylabel='Temperature [°C]')
ax1.plot(Temp_degC, 'ro')
ax1.grid()
ax2.set(xlabel='sample', ylabel='Humidity [%]')
ax2.plot(Hum_perc, 'ro')
ax2.grid()
ax3.set(xlabel='sample', ylabel='$CO_{2}$ [ppm]')
ax3.plot(CO2_ppm, 'ro')
ax3.grid()
fig.tight_layout()
import time
import datetime
import json
import requests
import serial

with open('device.json') as json_file:
    device = json.load(json_file)

# Time between two samples
SAMPLING_TIME = 20
nmb_samples = 10

# send data to the Cloud
for i in range(nmb_samples):
    start_sample = time.perf_counter()

    timestamp = datetime.datetime.utcnow().isoformat()
    sensor_data = ['OK', str(i), str(round(Temp_degC[i],1)), str(int(Hum_perc[i])), str(int(CO2_ppm[i])), 'X\r\n']

    response = send_data(device, timestamp, sensor_data)

    print('sample:',i, ' - ', timestamp,' - ', sensor_data, ' - ', response)

    finish_sample = time.perf_counter()
    time.sleep(int(SAMPLING_TIME) - int(round(finish_sample - start_sample, 2)))
Terminal output:
sample: 0  -  2021-08-27T08:32:53.982653  -  ['OK', '0', '10.0', '10', '0', 'X\r\n']  -  ok
sample: 1  -  2021-08-27T08:33:14.326736  -  ['OK', '1', '25.6', '20', '277', 'X\r\n']  -  ok
sample: 2  -  2021-08-27T08:33:34.558799  -  ['OK', '2', '41.1', '30', '555', 'X\r\n']  -  ok
sample: 3  -  2021-08-27T08:33:54.771425  -  ['OK', '3', '56.7', '40', '833', 'X\r\n']  -  ok
sample: 4  -  2021-08-27T08:34:15.004256  -  ['OK', '4', '72.2', '50', '1111', 'X\r\n']  -  ok
sample: 5  -  2021-08-27T08:34:35.217754  -  ['OK', '5', '87.8', '60', '1388', 'X\r\n']  -  ok
sample: 6  -  2021-08-27T08:34:55.440844  -  ['OK', '6', '103.3', '70', '1666', 'X\r\n']  -  ok
sample: 7  -  2021-08-27T08:35:15.669162  -  ['OK', '7', '118.9', '80', '1944', 'X\r\n']  -  ok
sample: 8  -  2021-08-27T08:35:35.883873  -  ['OK', '8', '134.4', '90', '2222', 'X\r\n']  -  ok
sample: 9  -  2021-08-27T08:35:56.144285  -  ['OK', '9', '150.0', '100', '2500', 'X\r\n']  -  ok
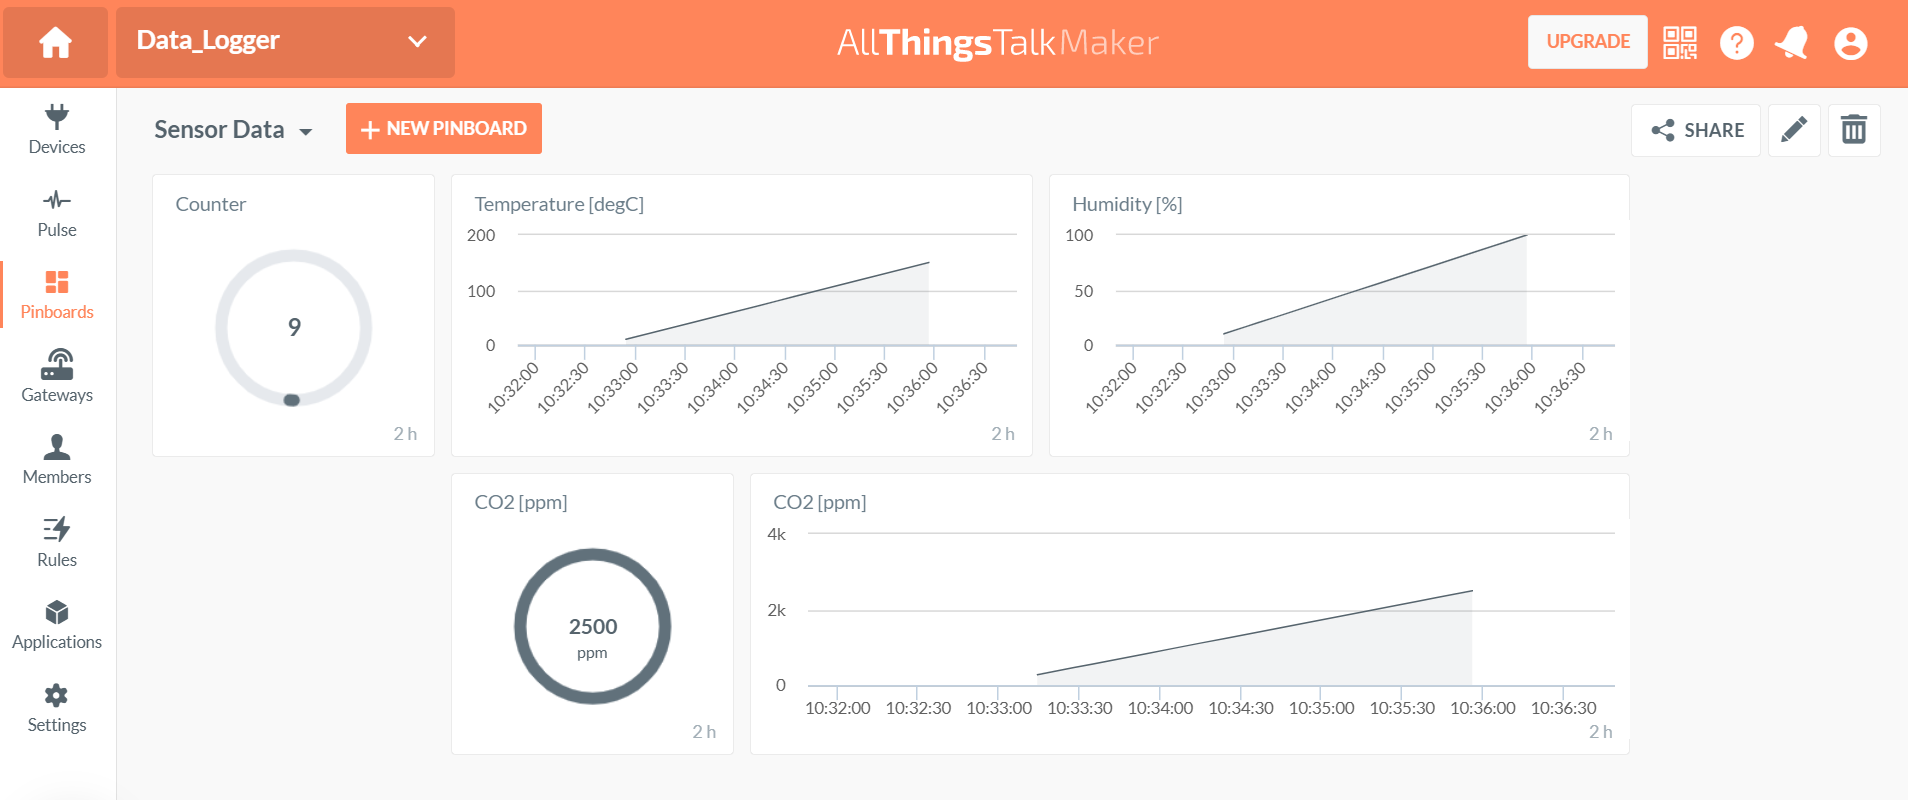
Data on the pinboard:
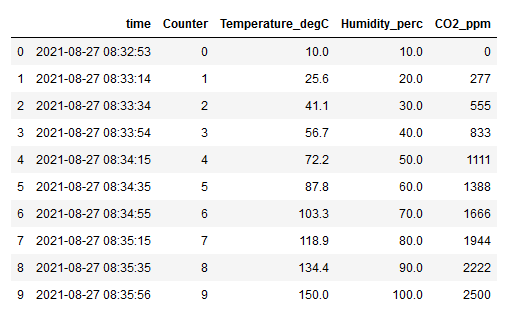
Below the Python script to retrieve data from the Cloud.
import json
import pandas as pd

with open('device.json') as json_file:
    device = json.load(json_file)

time_from = '2021-08-27T08:32:53'
time_to = '2021-08-27T08:35:57'

cloud_data_df = cloud_data_to_df(device, time_from, time_to)
cloud_data_df.head(10)
Dataframe (data from the Cloud):
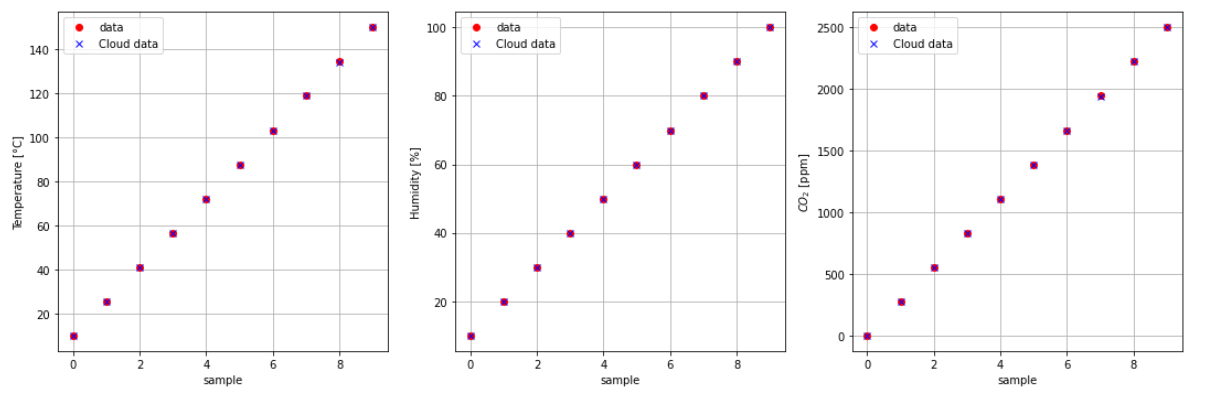
Comparison, data send and data retrieved.
fig, (ax1, ax2, ax3) = plt.subplots(1, 3, figsize=(15,5))
ax1.set(xlabel='sample', ylabel='Temperature [°C]')
ax1.plot(Temp_degC, 'ro', label='data')
ax1.plot(cloud_data_df['Temperature_degC'], 'bx', label='Cloud data')
ax1.grid()
ax1.legend()

ax2.set(xlabel='sample', ylabel='Humidity [%]')
ax2.plot(Hum_perc, 'ro', label='data')
ax2.plot(cloud_data_df['Humidity_perc'], 'bx', label='Cloud data')
ax2.grid()
ax2.legend()

ax3.set(xlabel='sample', ylabel='$CO_{2}$ [ppm]')
ax3.plot(CO2_ppm, 'ro', label='data')
ax3.plot(cloud_data_df['CO2_ppm'], 'bx', label='Cloud data')
ax3.grid()
ax3.legend()
fig.tight_layout()